Twitter Text Analytics in Node.js, Part 1
Twitter is a great resource to gauge public sentiment and opinion about your company’s brand, product or service. In this multi-part tutorial series, we are going to look at how you can extract and monitor sentiment and commentary about your brand/product/service. In particular, the first three parts of this series will cover the following topics:
- In this first part, we will get connected to twitter and start monitoring public interest and activity in terms of the number of tweets.
- The next installment will demonstrate how to extend the application to evaluate public sentiment using the LX NLP sentiment analysis pipeline.
- The final tutorial of the first set will describe how to discover what people are saying via named-entity recognition and noun-phrase extraction.
Throughout the series we will be using the LX NLP Node.js API available on Amazon’s AWS Marketplace - LX NLP Server. The tutorial assumes familiarity with launching and configuring EC2 instances and writing Node.js code.
In order to run the examples presented, you will need to have Twitter API keys for access to the Twitter feed. If you do not already have those, see the Twitter Keys and Tokens post for instructions.
Let’s get started. In this installment we are going to be writing a Twitter client the receives a stream of Twitter posts for a particular topic, logs them for latter analysis and collects some metrics for display on a nice Web dashboard.
Server Setup
In this first step, we are going to launch the VM on EC2 and setup a dashboard package that we can send metrics to for display.
The default security group will not allow access to the dashboard we are going to setup. Before creating the VM, make sure you have a security group or create one with at least the following rules:
| Type | Protocol | Port Range | Source |
| SSH | TCP | 22 | 0.0.0.0 |
| HTTP | TCP | 80 | 0.0.0.0 |
| Custom TCP | TCP | 8090 | 0.0.0.0 |
The dashboard will be available on port 8090.
Launch the VM
- Visit the LX NLP Server page to launch the VM and be sure to change the default security group to the one with the above rules.
- Connect to the new VM with ssh or putty as user name ec2-user for the rest of the tutorial.
Enable Graphite/Grafana services
The next step will be to setup the dashboard on the new VM. All the necessary software is pre-installed, but not enabled by default. Let’s enable it:
sudo systemctl start graphite
sudo systemctl start grafana-server.service
These commands start the metrics database software Graphite and the Grafana dashboard server. You can also enable these to start automatically at boot time as follows:
sudo systemctl enable graphite
sudo systemctl enable grafana-server.service
You should now be able to visit http://<your VM address>:8090/ to access Grafana. The default username is admin with password admin. Of course, there is no data to display yet, so we’ll come back to Grafana in a later section.
Writing the Twitter client
Install 3rd-party Node.js modules
I evaluated a couple of different modules for logging and connecting to Twitter. I found winston to be a pretty comprehensive module for logging. Connecting to Twitter with the twit module is easy and has proven to be very stable. These modules are not pre-installed, so create a folder for the project, and install them in the project directory:
mkdir tutorial
cd tutorial
/opt/node32/bin/npm install winston
/opt/node32/bin/npm install twit
Configure the modules
We are now ready to begin our Node.js Twitter client. Create a file named client.js and start by adding all the required modules:
var stats = require('dashstats');
var winston = require('winston');
var twit = require('twit');
I’ve already mentioned twit and winston. The dashstats module is a locally install convenience library that makes it easy to send metrics to Graphite/Grafana.
Each of these modules requires some configuration so let’s look at each in turn. First, configure a logger that we can write tweets to for future analysis:
var tweetLog = new (winston.Logger)({
    transports: [
    new (winston.transports.DailyRotateFile)({
        filename: __dirname + '/tweets'
        })
    ]
});
The filename attribute is the base name for the log files and
__dirname refers to the directory where the Node.js script is
located. By using the DailyRotateFile transport, winston will
create a new file each day with the date as part of the file name.
There is a simpler API for creating a log with winston, but we want to configure the log specifically to auto-rotate each day. Having one log file per day will make it easy to go back and see what people were tweeting about on a particular date and monitor changes from day to day. The third part of this tutorial series will focus on analyzing these log files.
Now, configure the twit module with your Twitter account access information:
var twitter = new twit({
  consumer_key: '<consumer key>',
  consumer_secret: '<consumer secret>',
  access_token: '<your access token>',
  access_token_secret: '<your access token secret>'
});
Copy and paste these four values from the application management section of your Twitter account. See my previous post for details if you have not already setup your Twitter account: Twitter Keys and Tokens.
Finally, the only configuration the dashstats modules requires is to start it:
stats.start();
Process the Twitter stream
Now for the core part of the client, processing tweets. There are a couple of different ways to access data from TWitter. In this case, we are interested in following tweets related to our brand, product or service. To do that, you can subscribe to the Twitter public feed by keywords. The API works by making a single long-standing connection to Twitter to receive tweets matching your keywords as they are published. The requirements for the connection are a little involved, but fortunately all those details are managed for us by the twit module. All we need to do is provide the keywords.
To establish the connection, call the stream method on the twitter object we configured above:
var stream = twitter.stream('statuses/filter', { track: 'final fantasy', language: 'en' });
Here statuses/filter is the type of stream we are requesting and the
track attribute specifies the keywords that we want to track. This
call establishes the connection asynchronously and we can subscribe to
a number of events on the stream object to handle connection activity.
The main event is ‘tweet’ and we can register our handler for tweets as follows:
stream.on('tweet', function (tweet) {
    if (tweet.text) {
        stats.increment('twitter.tweet.count',1);
        tweetLog.info(tweet.text);
    }
});
There are other messages that come through the stream other than tweets, so we first check to see if it is actually a tweet by checking for the presence of the text field. If it is a tweet we 1) write the text of the Tweet to our log file and 2) increment a counter metric named twitter.tweet.count in Graphite/Grafana. You can name the counter anything you like just as long as it ends with .count to indicate that it is a counter.
With this, we now have enough code to actually run it and receive data from Twitter. Go ahead and run the code with:
/opt/node32/bin/node client.js
You should start seeing data almost immediately in the log file within the script directory. If you’re not getting any tweets then proceed to the next section and we’ll add some error handling.
Error handling
Up near the top of the file, create another log file for error handling as follows:
var errorLog = new (winston.Logger)({
    transports: [
        new (winston.transports.File)({
            maxsize: 10*1024*1024,
            tailable: true,
            handleExceptions: true,
            filename: __dirname + '/twitter-error.log'
        })
    ]
});
This time, we’ve used a File transport. This log file will be
rotated whenever it reaches the maxsize and tailable means the log
files will be numbered from most recent to oldest. The
handleExceptions attribute indicates that uncaught Javascript
exceptions will be automatically appended to this log in addition to
anything we explicitly add to the log.
We can now use this logger to log some additional events from the Twitter stream. Add the following handlers at the end of the file:
stream.on('reconnect', function (request, response, interval) {
    errorLog.warn('RECONNECT in ' + interval);
});

stream.on('disconnect', function (msg) {
    errorLog.warn(msg);
});

stream.on('warning', function (warning) {
    errorLog.warn(warning);
});
Notice that these are all warnings. Disconnection and reconnection are all managed internally by the wonderful twit module.
Handling spam
More than likely, you will find that the tweets you receive include a decent volume of spam. There are a couple of ways to deal with spam. You could build a simple list of spam words by scanning through one of the log files and picking out the common terms. Or as I’ve done here, you can just filter out anything that contains a link. This later approach may filter out more than you would like, however.
Try replacing the tweet event handler with the following to exclude tweets containing links:
stream.on('tweet', function (tweet) {
    if (tweet.text) {
        if (tweet.text.search(/[hH][tT][tT][pP][sS]?:\/\//) < 0) {
            stats.increment('twitter.tweet.count',1);
        } else {
            stats.increment('twitter.spam.count',1);
        }
        tweetLog.info(tweet.text);
    }
});
In this example, tweets with links are only filtered out for counting, and all tweets are written to the log file. You may be interested in some of the tweets containing links in your log analysis, such as popular retweets of YouTube videos or reviews. Also, you can sum the twitter.tweet.count and twitter.spam.count metrics in Grafana to display both the individual and combined counts.
Displaying metrics
Visit http://<your VM address>:8090/ and login with the username admin and password admin.
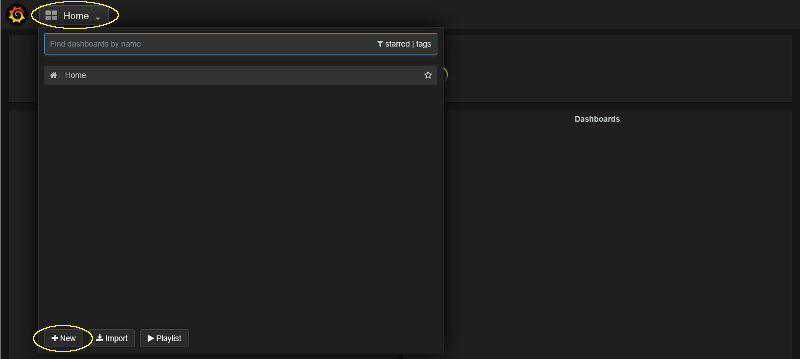
Create a new dashboard by clicking home and then the + New button.
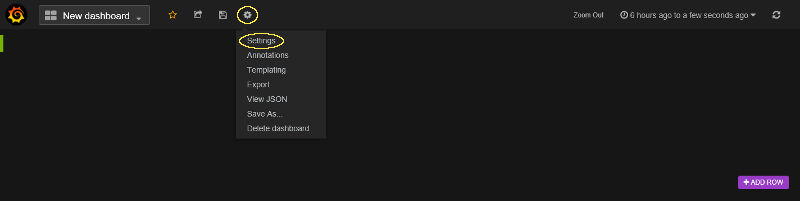
Edit the dashboard settings by clicking the gear icon and selecting Settings.
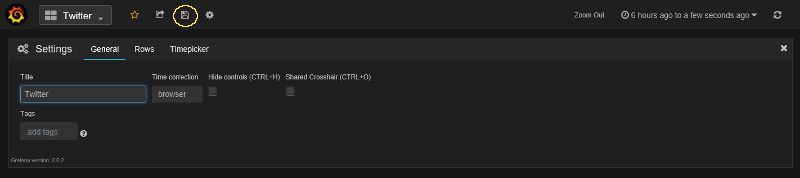
Enter a title and click the save button.
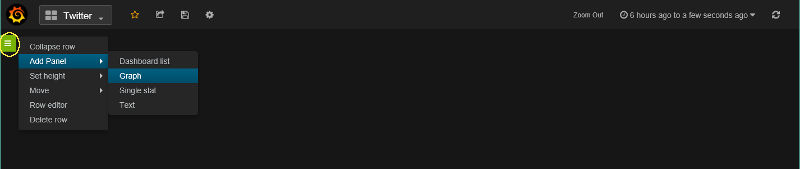
Add a new graph to the dashboard by clicking on the green flyout menu and selecting Add Panel -> Graph.
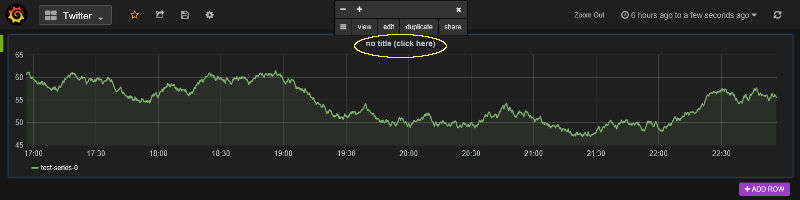
Configure the new graph by clicking on the title and selecting edit from the popup.
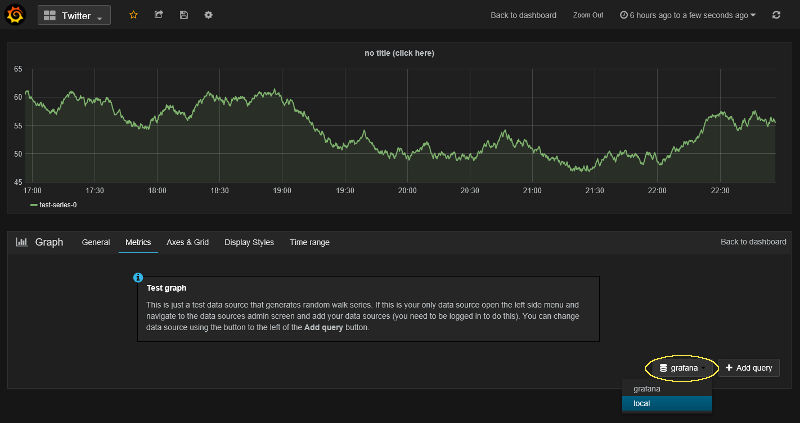
Change the graph’s data source to the local Graphite database by clicking the data source menu at the bottom of the panel and selecting local.
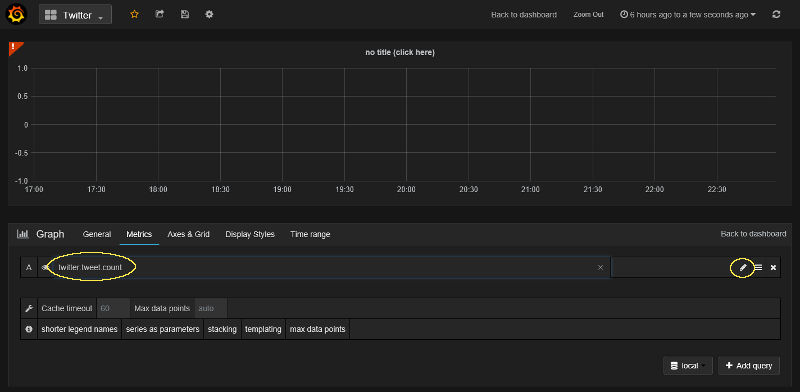
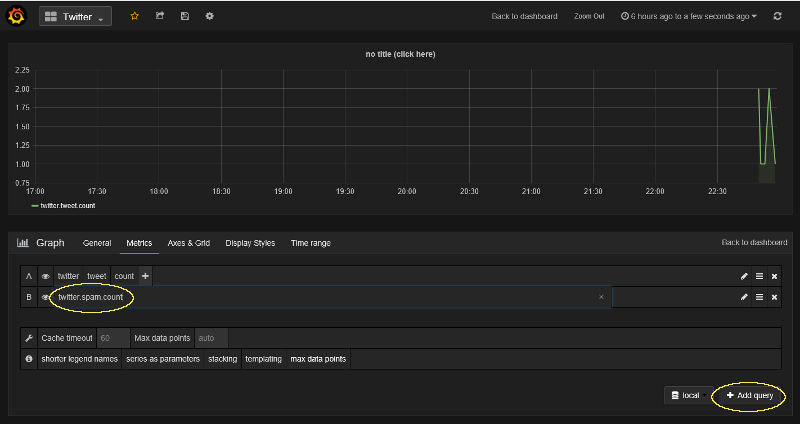
Add the twitter.tweet.count metric that we are sending from our
Node.js client to the graph by clicking on the pencil icon and
entering the name.
If you added spam filtering as suggested above then you can also add the spam metric by clicking Add Query and entering the name twitter.spam.count.
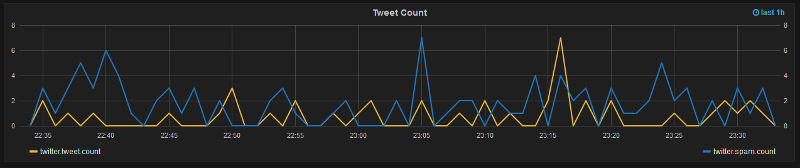
Now that you have some metrics displayed, play around with the settings in the other tabs like General, Display Styles and Time Range. The default range of 1 hour is a nice graph just to show that the service is running.
Another useful tip is click on the colored line in the legend to change the color and choose the left or right side for the metric’s y access.
In the end, I end up with something like this for my 1 hour “heartbeat” graph.
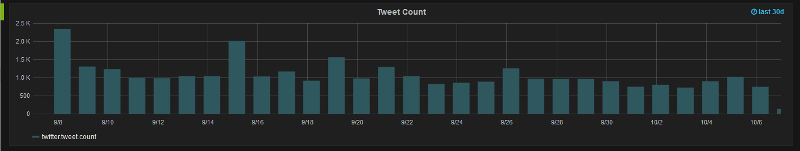
Try adding other graphs with other ranges like 24h or 30d. For example, I use this my 30 day graph to identify days of increase chatter for further analysis.
Closing
That concludes part 1 of the tutorial. The source code from this tutorial is also available from the GitHub blog repository.
Please leave your comments and suggestions below. Also, don’t miss the rest of the series - use the contact links at the very bottom of this site to follow me on Twitter or LinkedIn!
Subscribe via RSS